Image Segmentation Using MATLAB
Vignesh
Image Preparation using MATLAB
Image contrast can be adjusted using several functions such as histeq, imadjust, and adapthisteq available in the image processing toolbox. Sample contrast enhancement code can be found in this github repository.
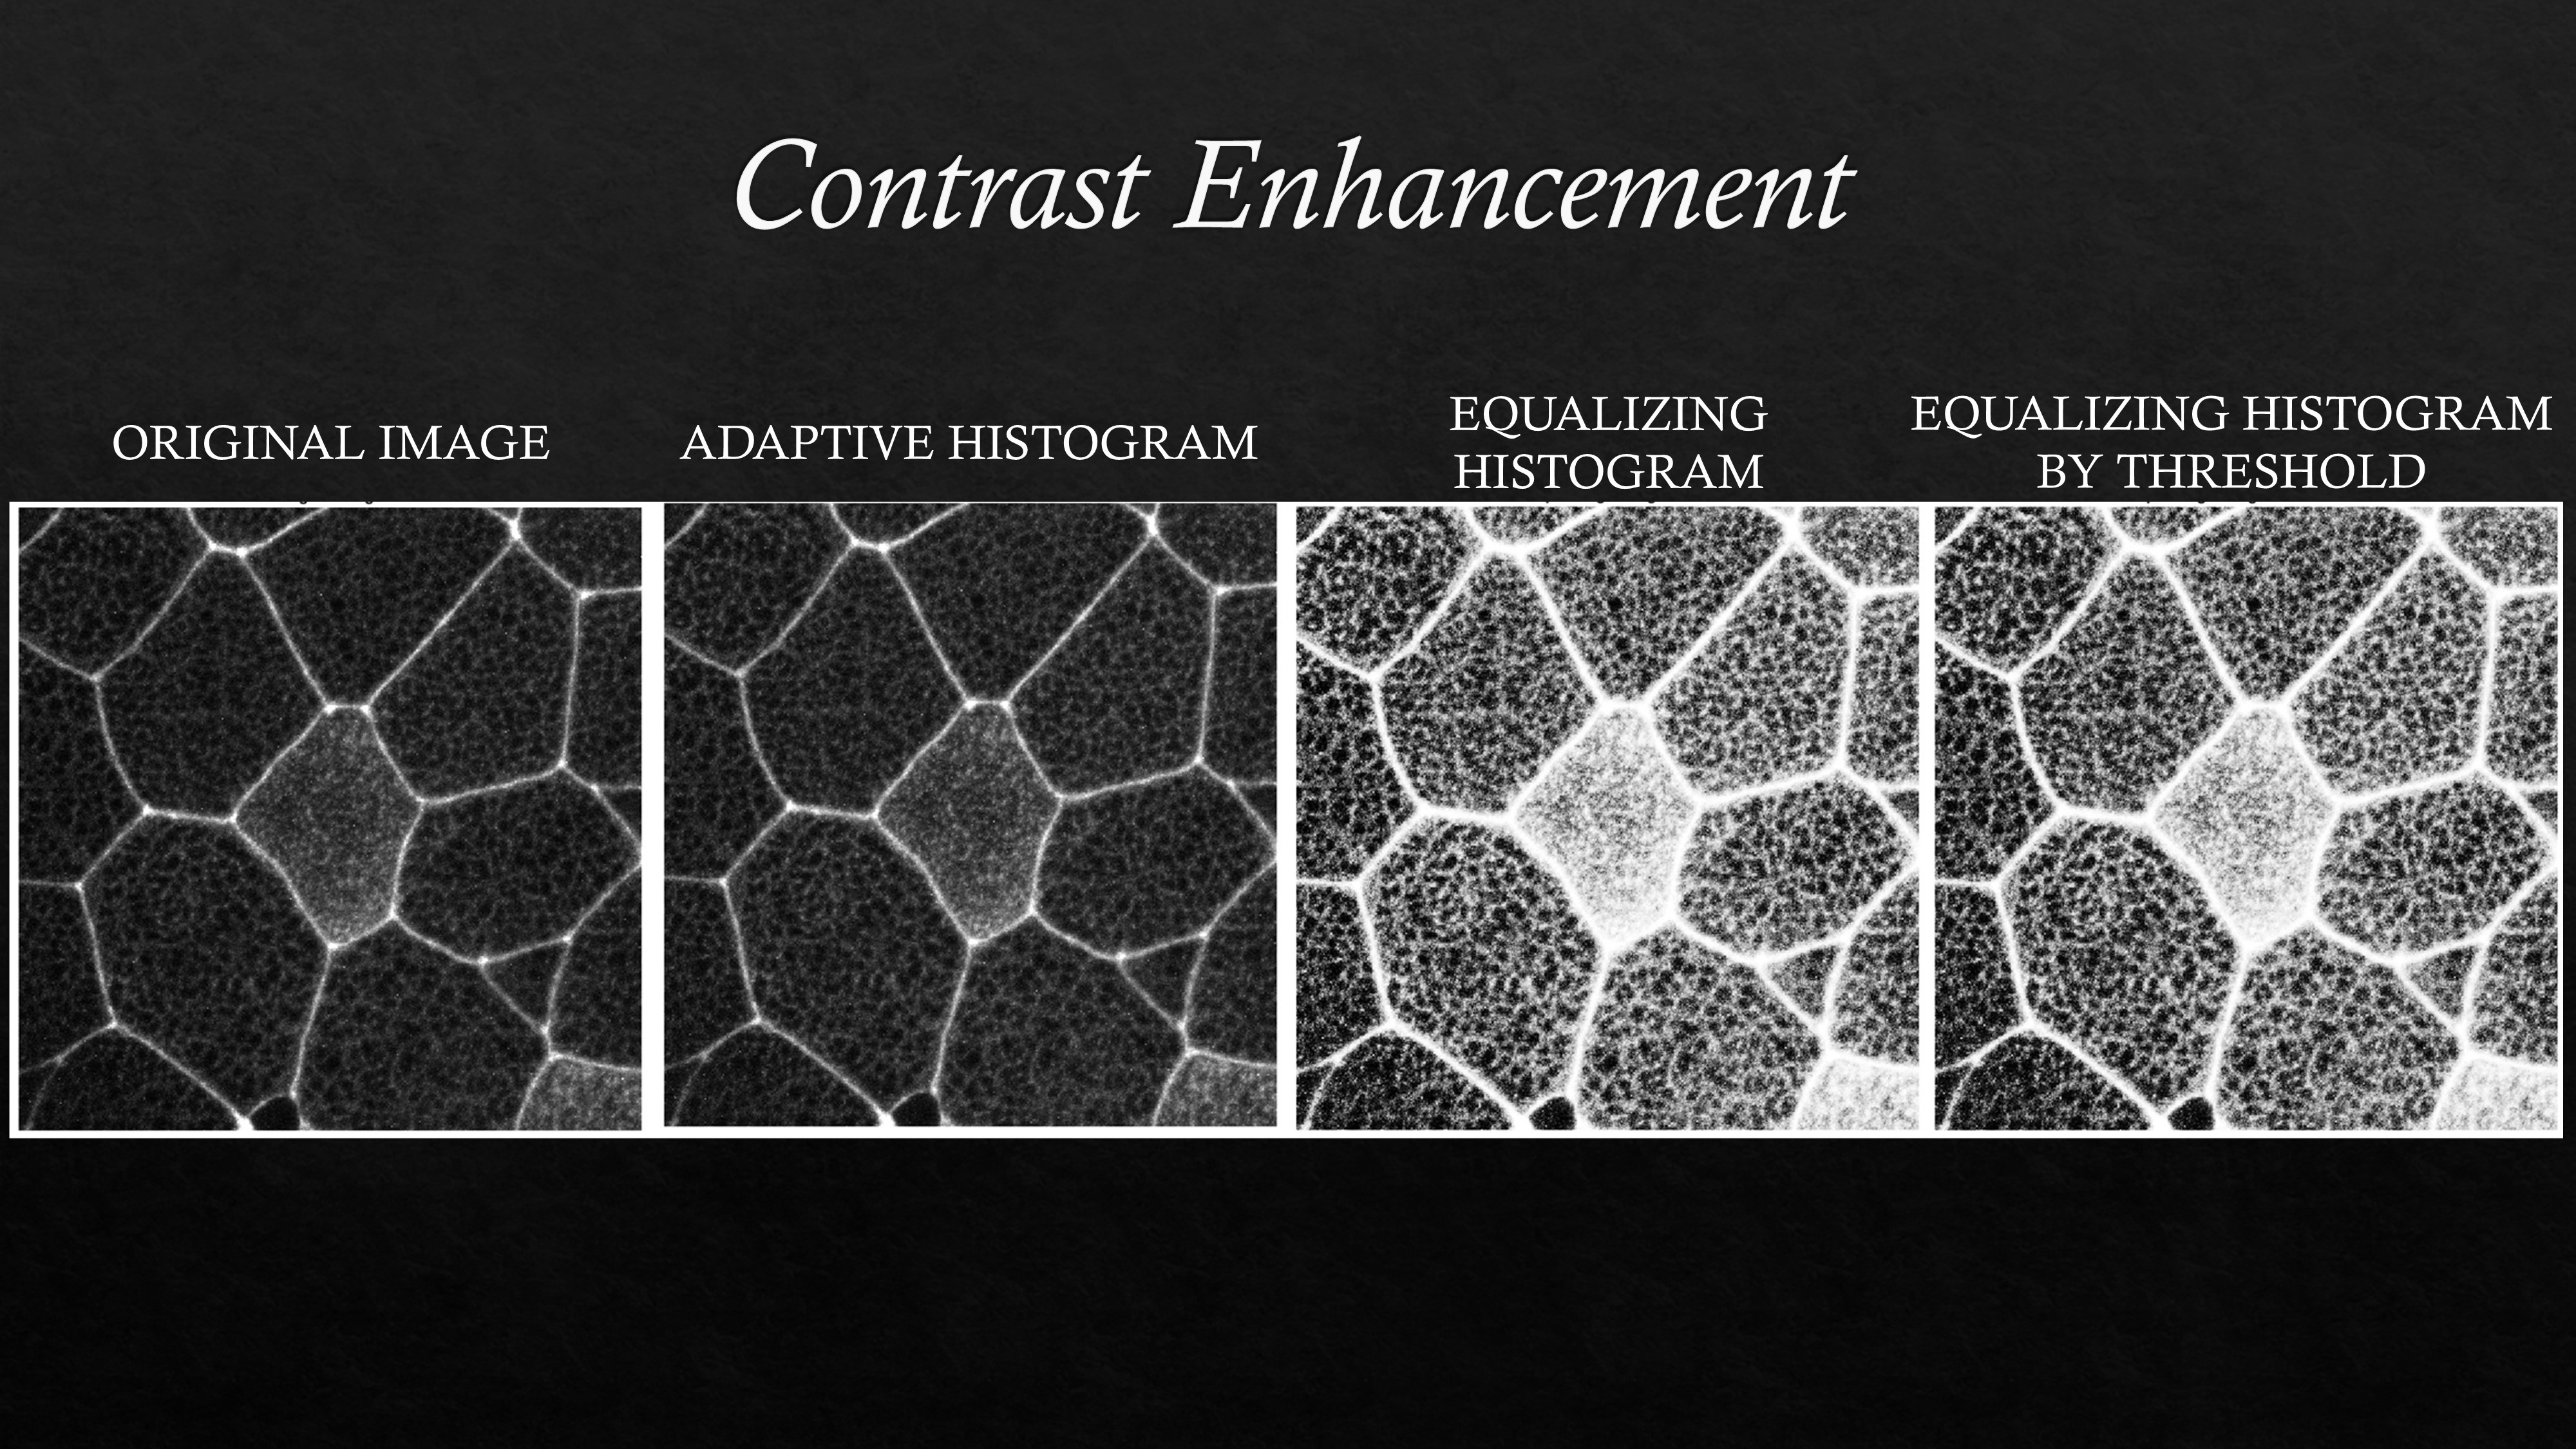
An example image is shown above (left most) after adjusting the contrast with different functions
Background noise in the image can be subtracted by selecting a rectangular region of interest (ROI) and subtracting the average grayscale value over the 8 bit or 16 bit images. An example MATLAB code to do background subtraction can be found in this github repository.
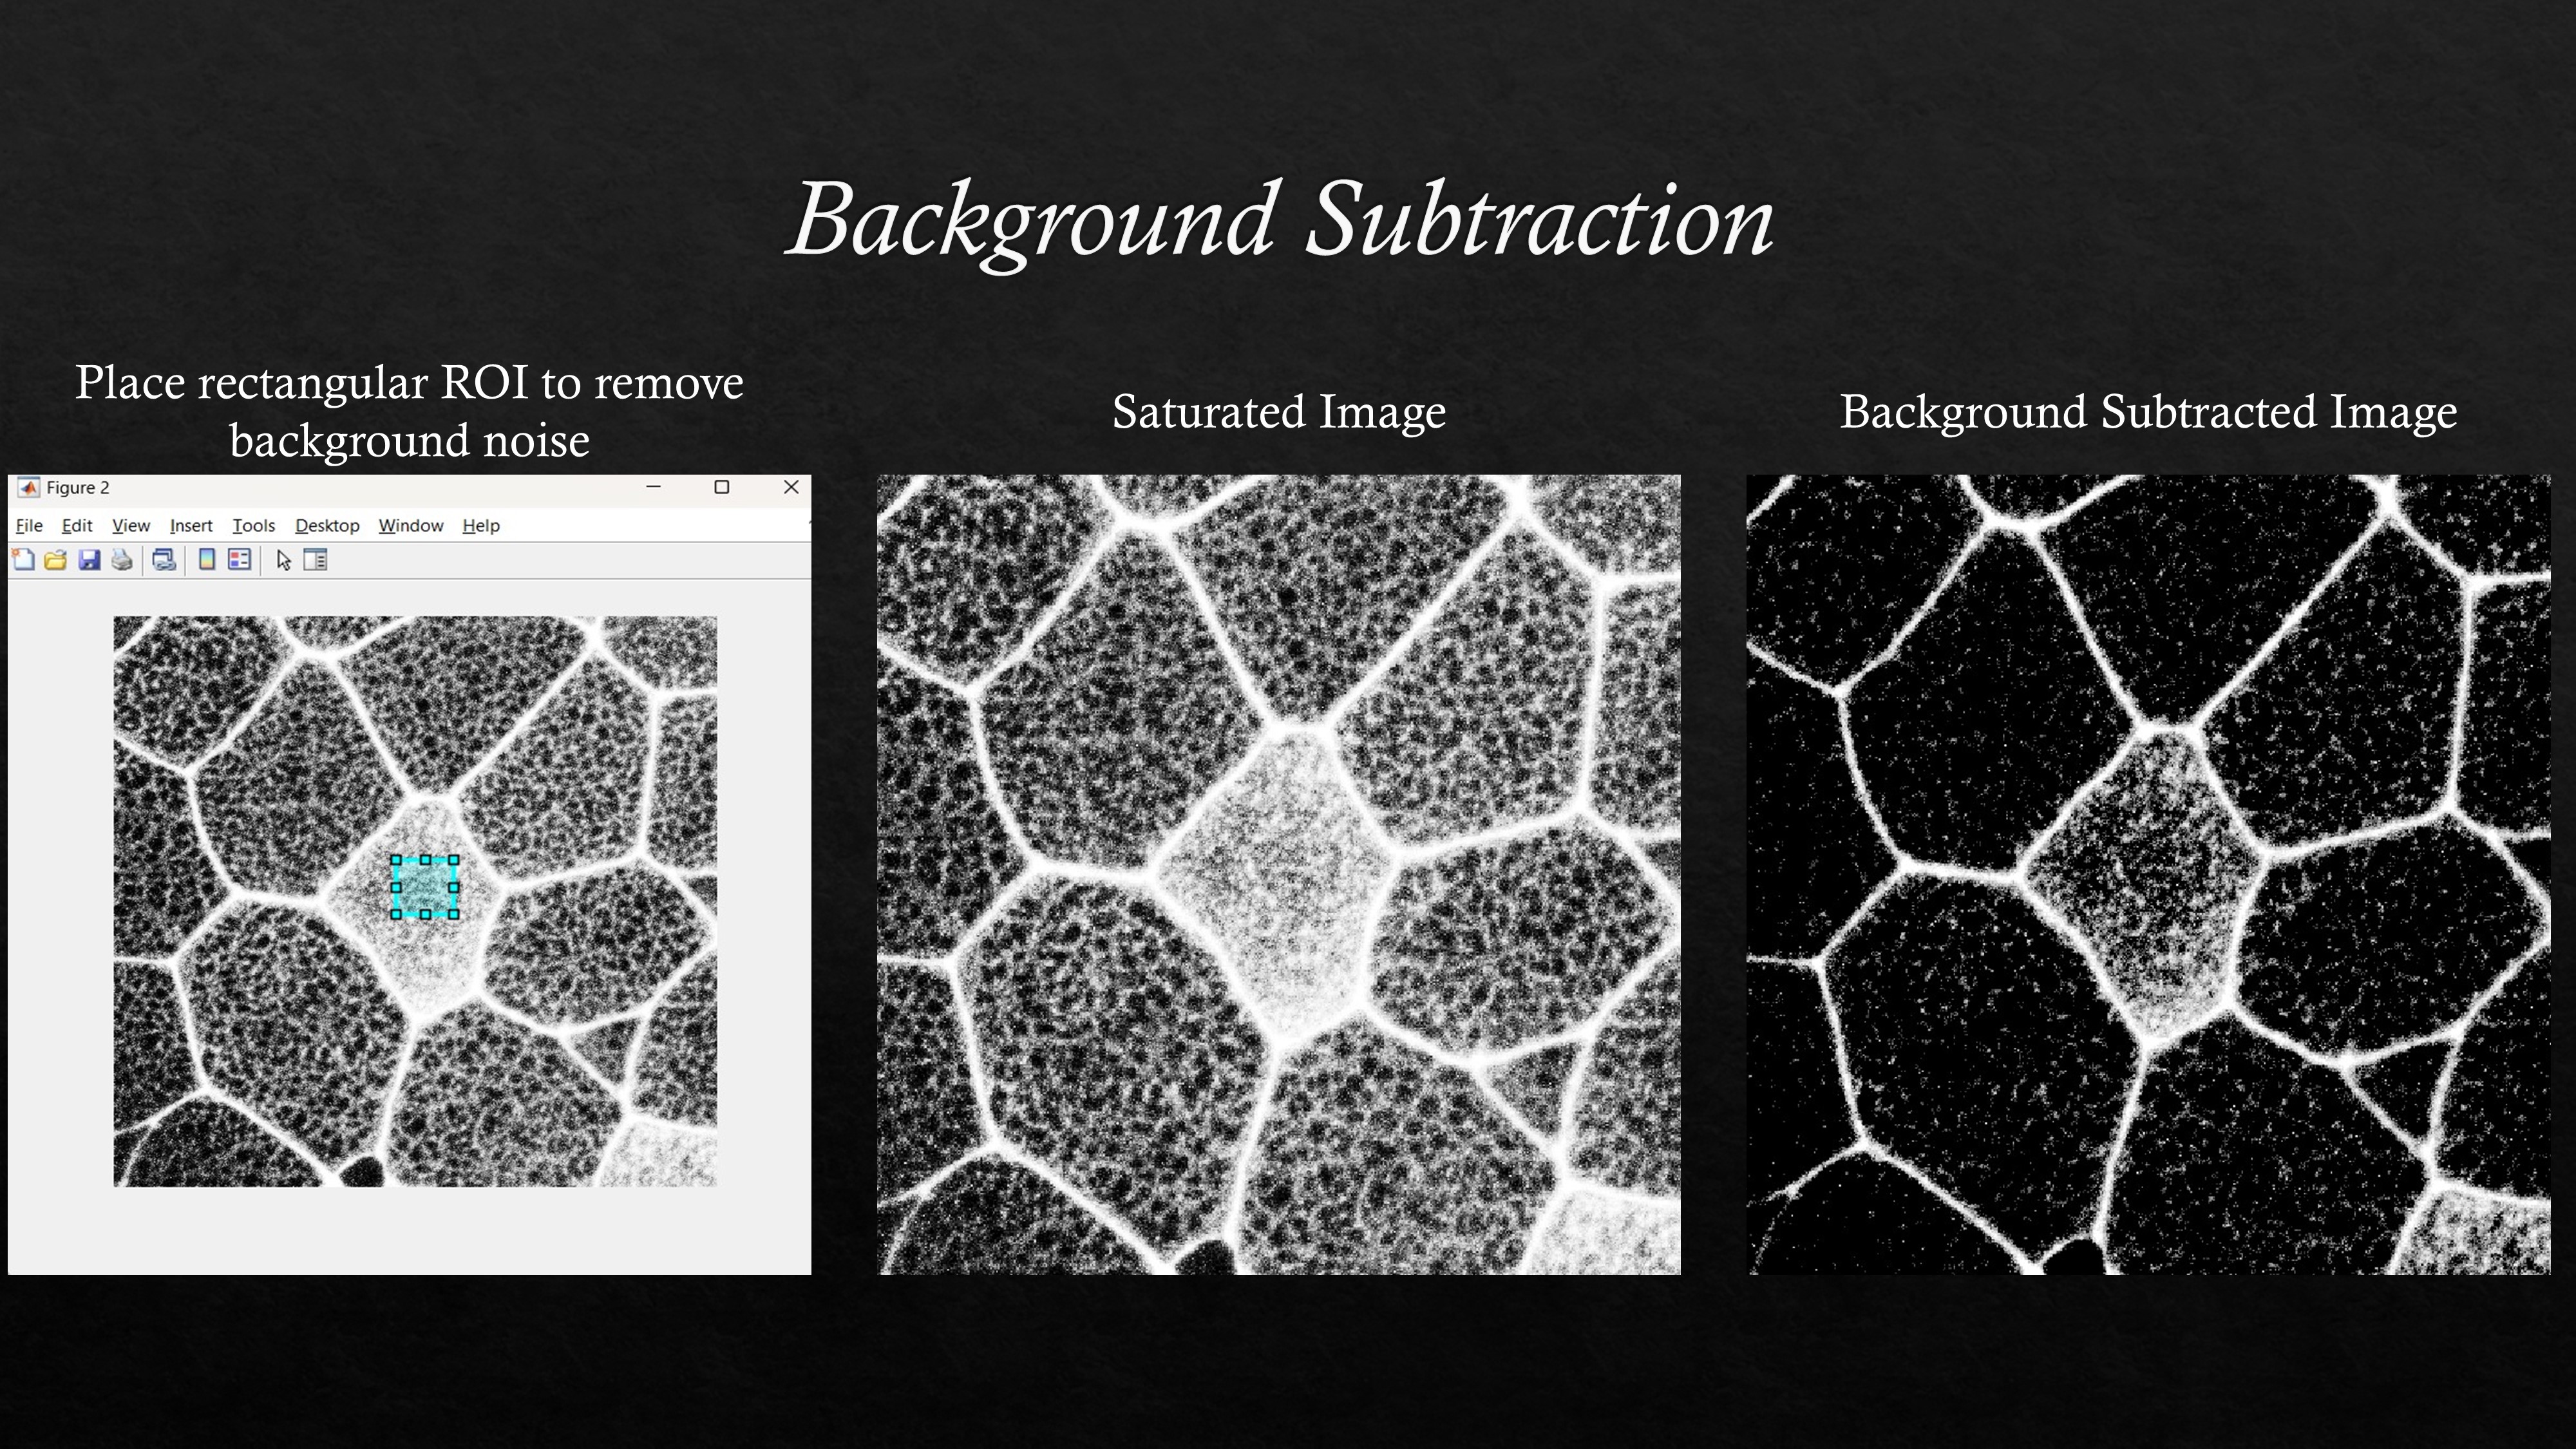
An example background subtraction is shown for a saturated image
White noise or speckles in the background can be removed using wiener or median filters in MATLAB among other functions which are also available in the image processing toolbox. An example code can be found here.
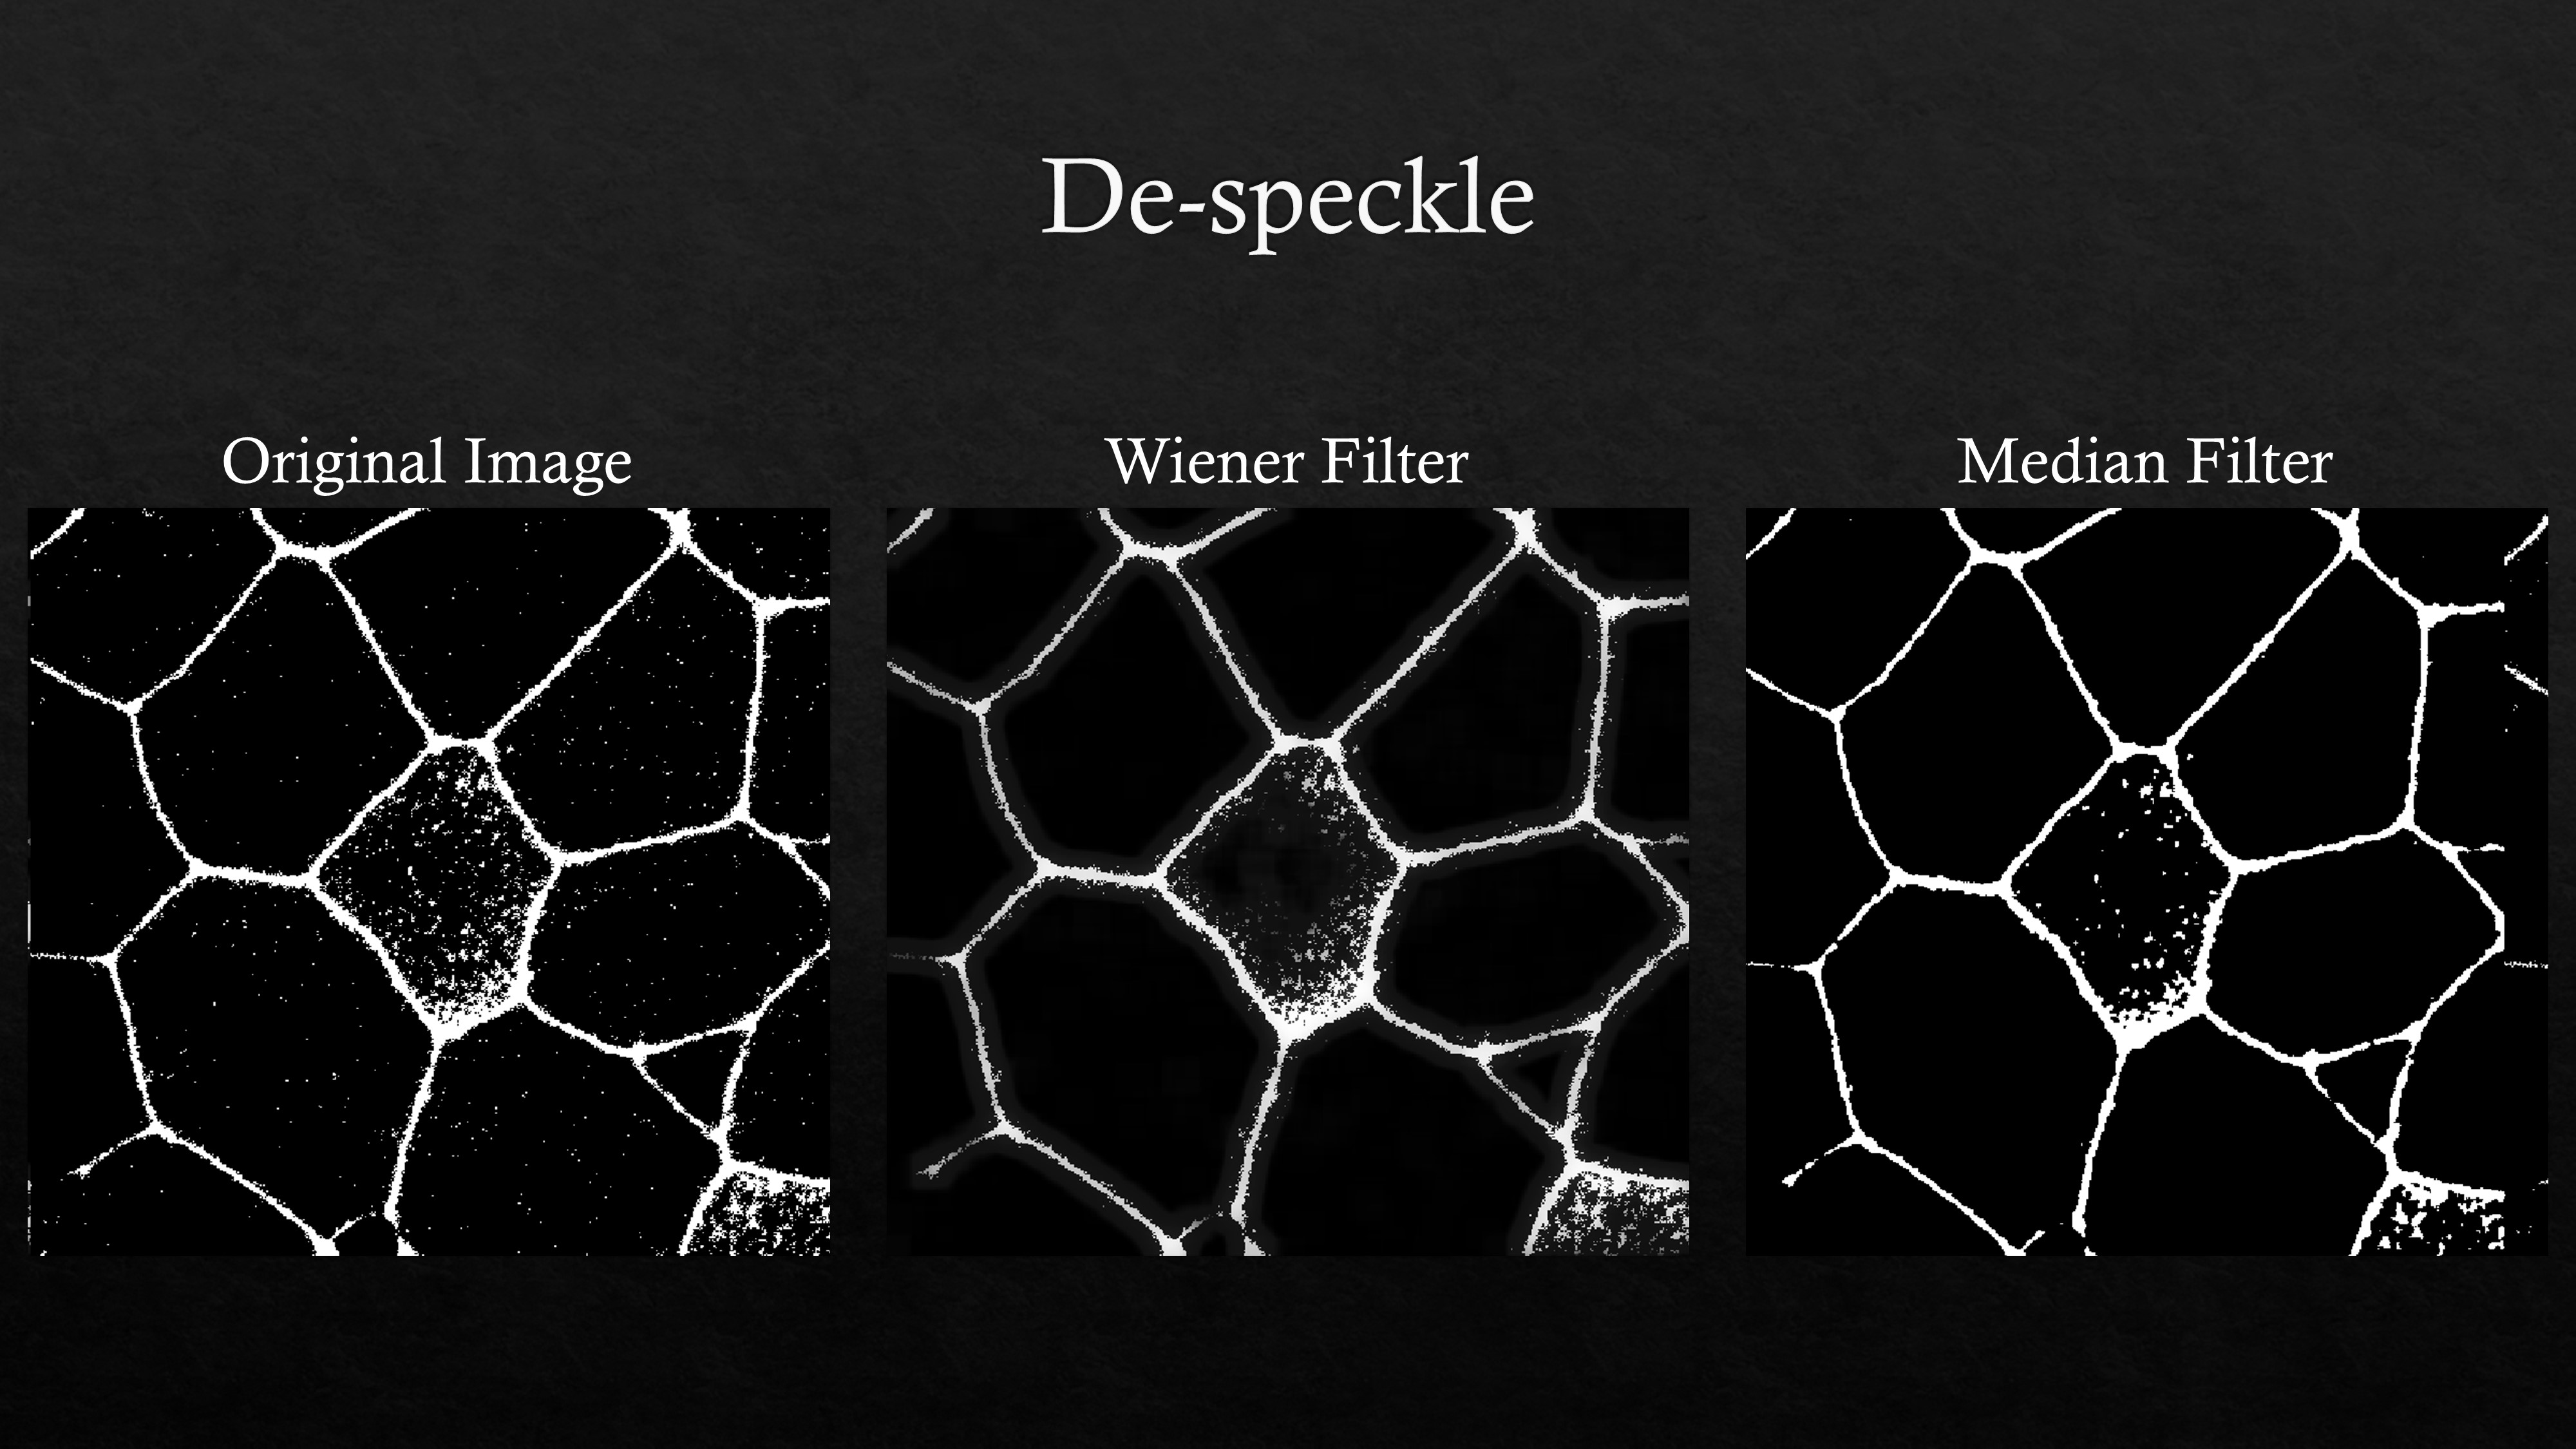
An example de-speckling of a noisy image using MATLAB filters is shown above
Cell Segmentation Using MATLAB
Image processing toolbox in MATLAB can be used for segmenting cells manually using an ROI (region of interest) tool or using in-built functions such as watershed or edge detection functions such as canny, sobel, etc. The custom written MATLAB script can be used to automatically identify and create masks or skeleton of the cells. The quality of the image and the threshold chosen for watershed in the script might affect the accuracy of the traced cells. Segmentation of cells specifically near the edges might be erroneous.

Automated cell segmentation using MATLAB
Multiciliated Cell Segmentation (Manual)
In case of small image sets or tracing specific cells that require high accuracy or if segmentation is difficult to automate because of heterogeneity in the image, polygon tool in MATLAB can be used to trace cells manually. Running the MATLAB script will ask the user to input images (For multiciliated cell choose actin and cilia images). The images are overlayed and then the user can start tracing the cells. The coordinates of the traced cells will be stored and loop can be exited by clicking the ‘Quit’ button in the dialogue box. If the tracing needs to be done in several parts, ‘save work in progress’ and ‘continue working’ section can be run to save and resume working on manual segmentation later.
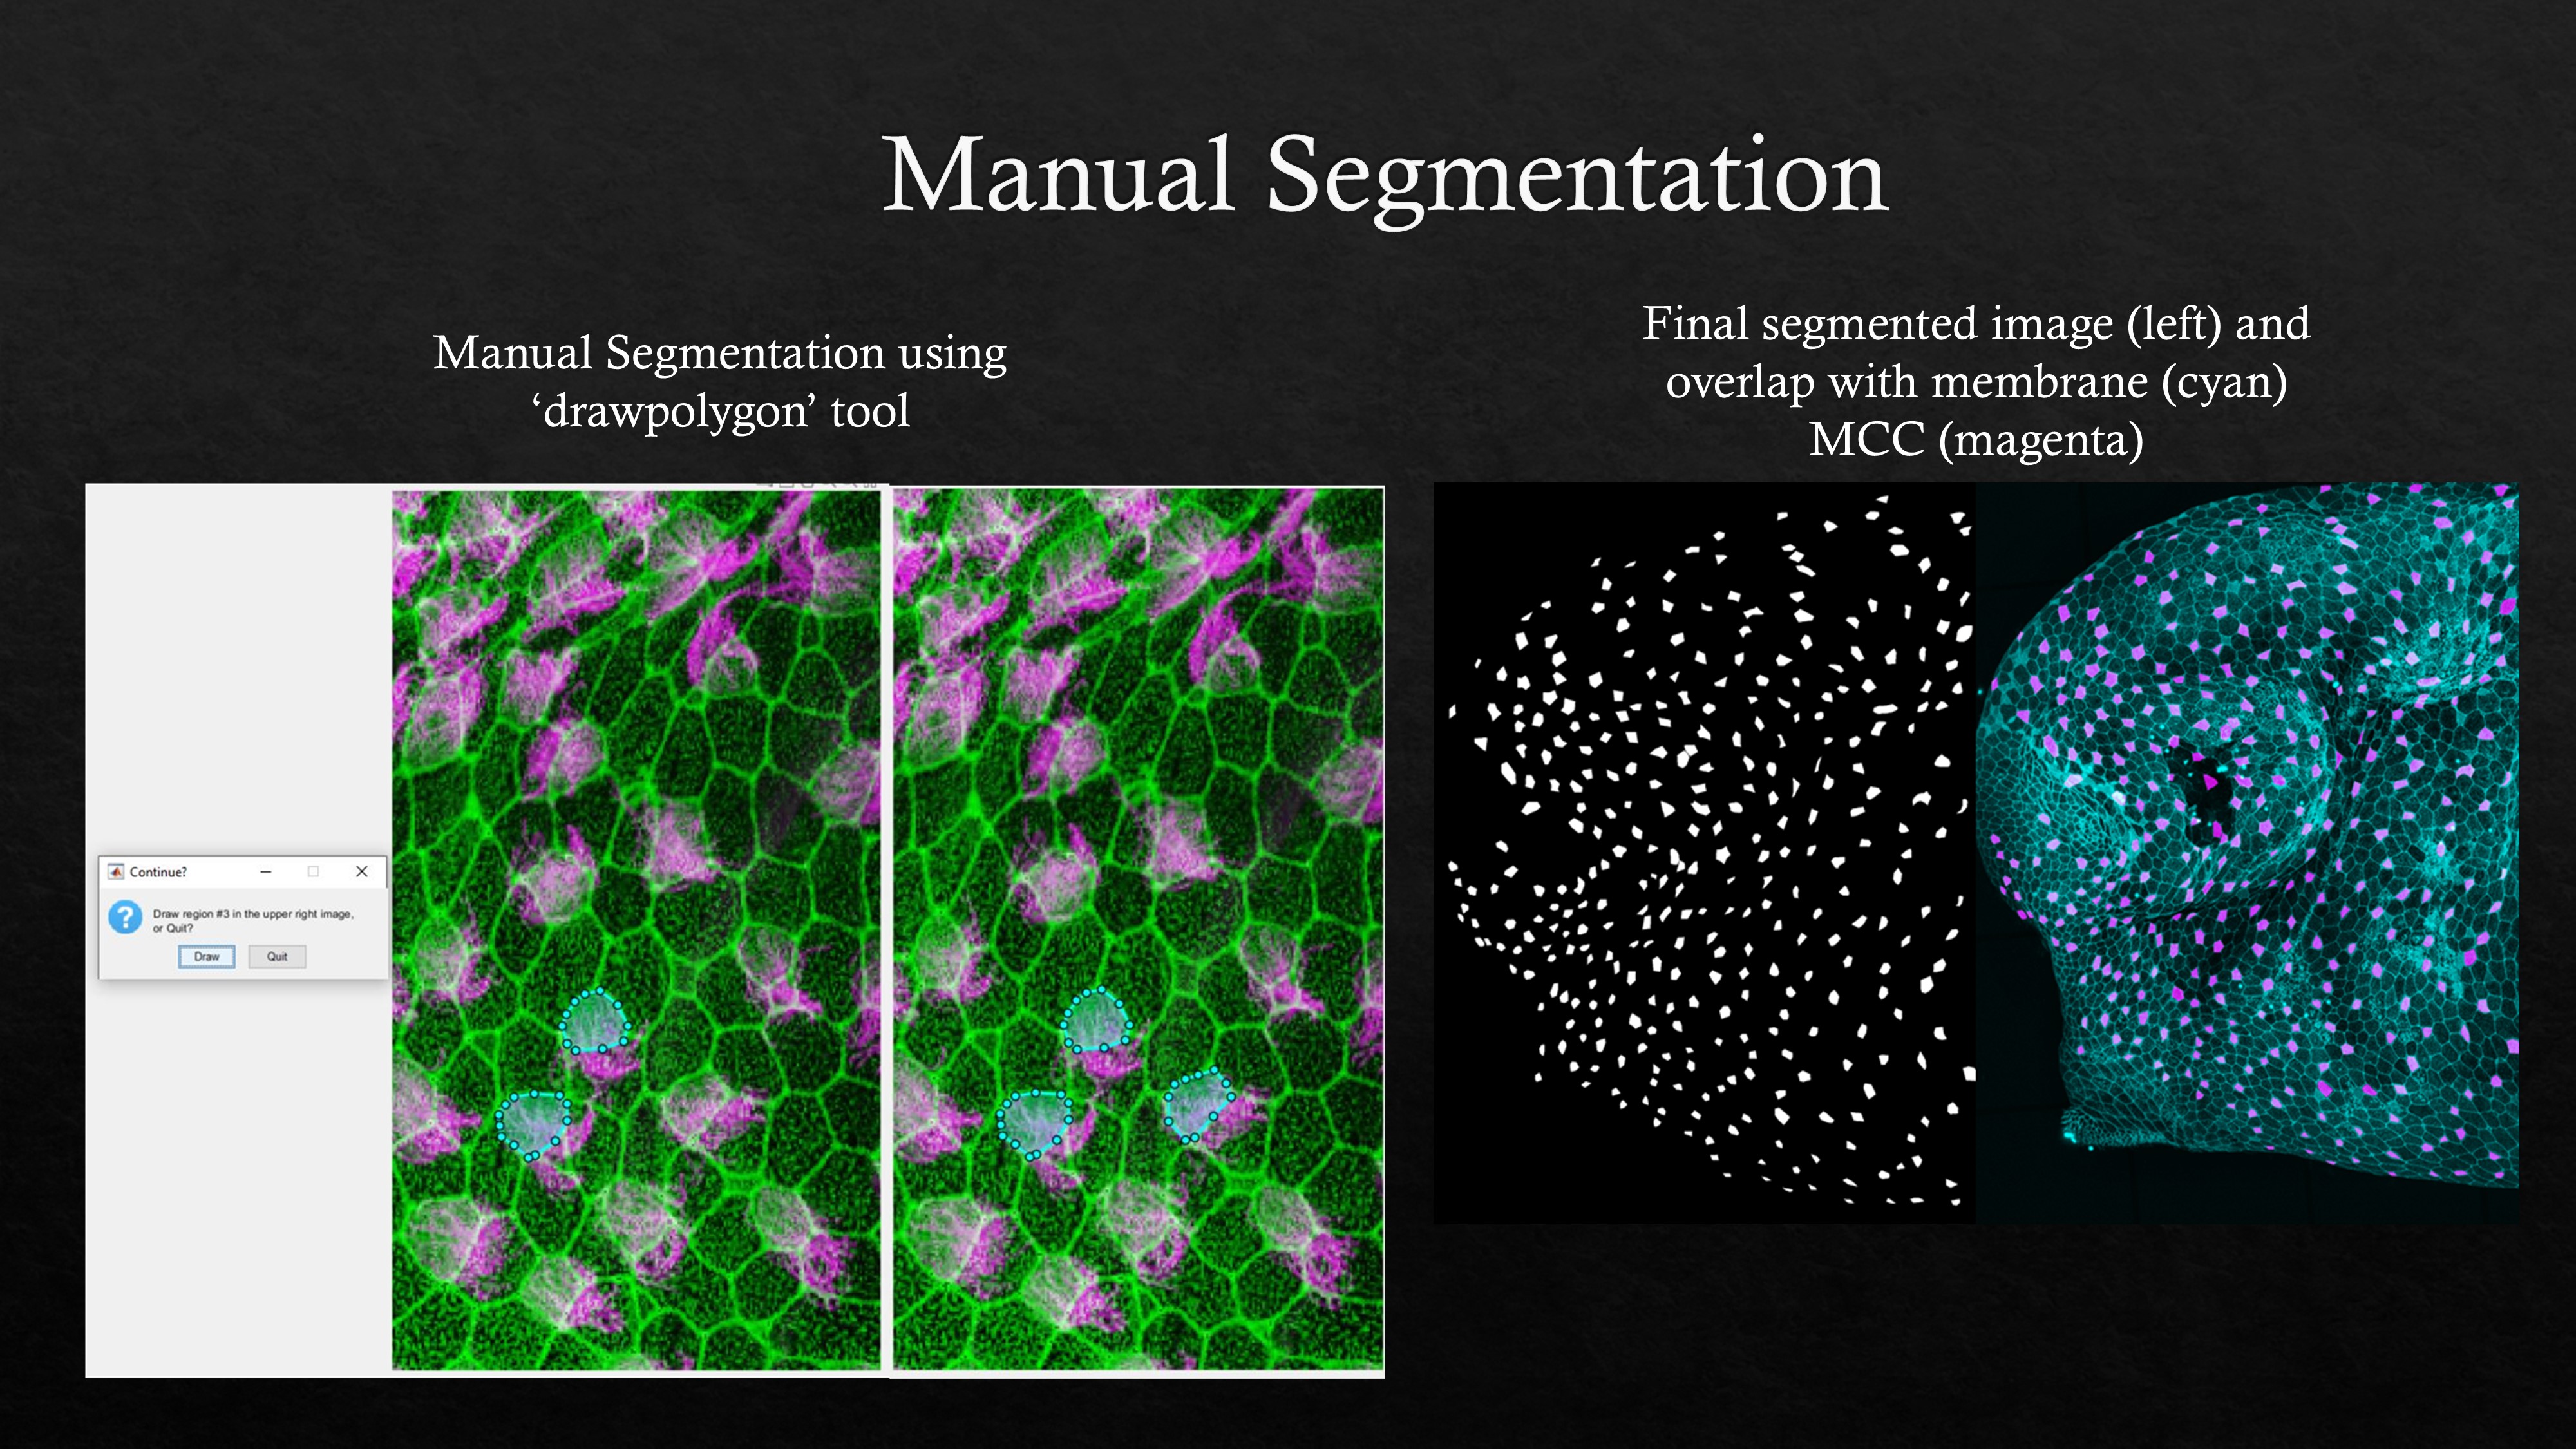
An example showing manual segmentation of multiciliated cells on the skin of Xenopus tropicalis embryo using ‘drawpolygon’ ROI tool in MATLAB

Automated segmentation of non-multiciliated cells (center) and manual segmentation of multiciliated cells (right)
Cell Property Visualization & Analysis
After running the first three blocks of the MATLAB script, ‘Get region properties’ can be run to create cell property plots utilizing the ‘regionprops’ function. Pixel to micron factor (pf) value needs to be set to get the cell properties in the units of microns along with surface color gradient plots normalized to the physical values.

Example cell properties (cell area, cell aspect ratio, and cell circularity) are shown for non-multiciliated cells (top row) and multiciliated cell (bottom row) based on the previous image
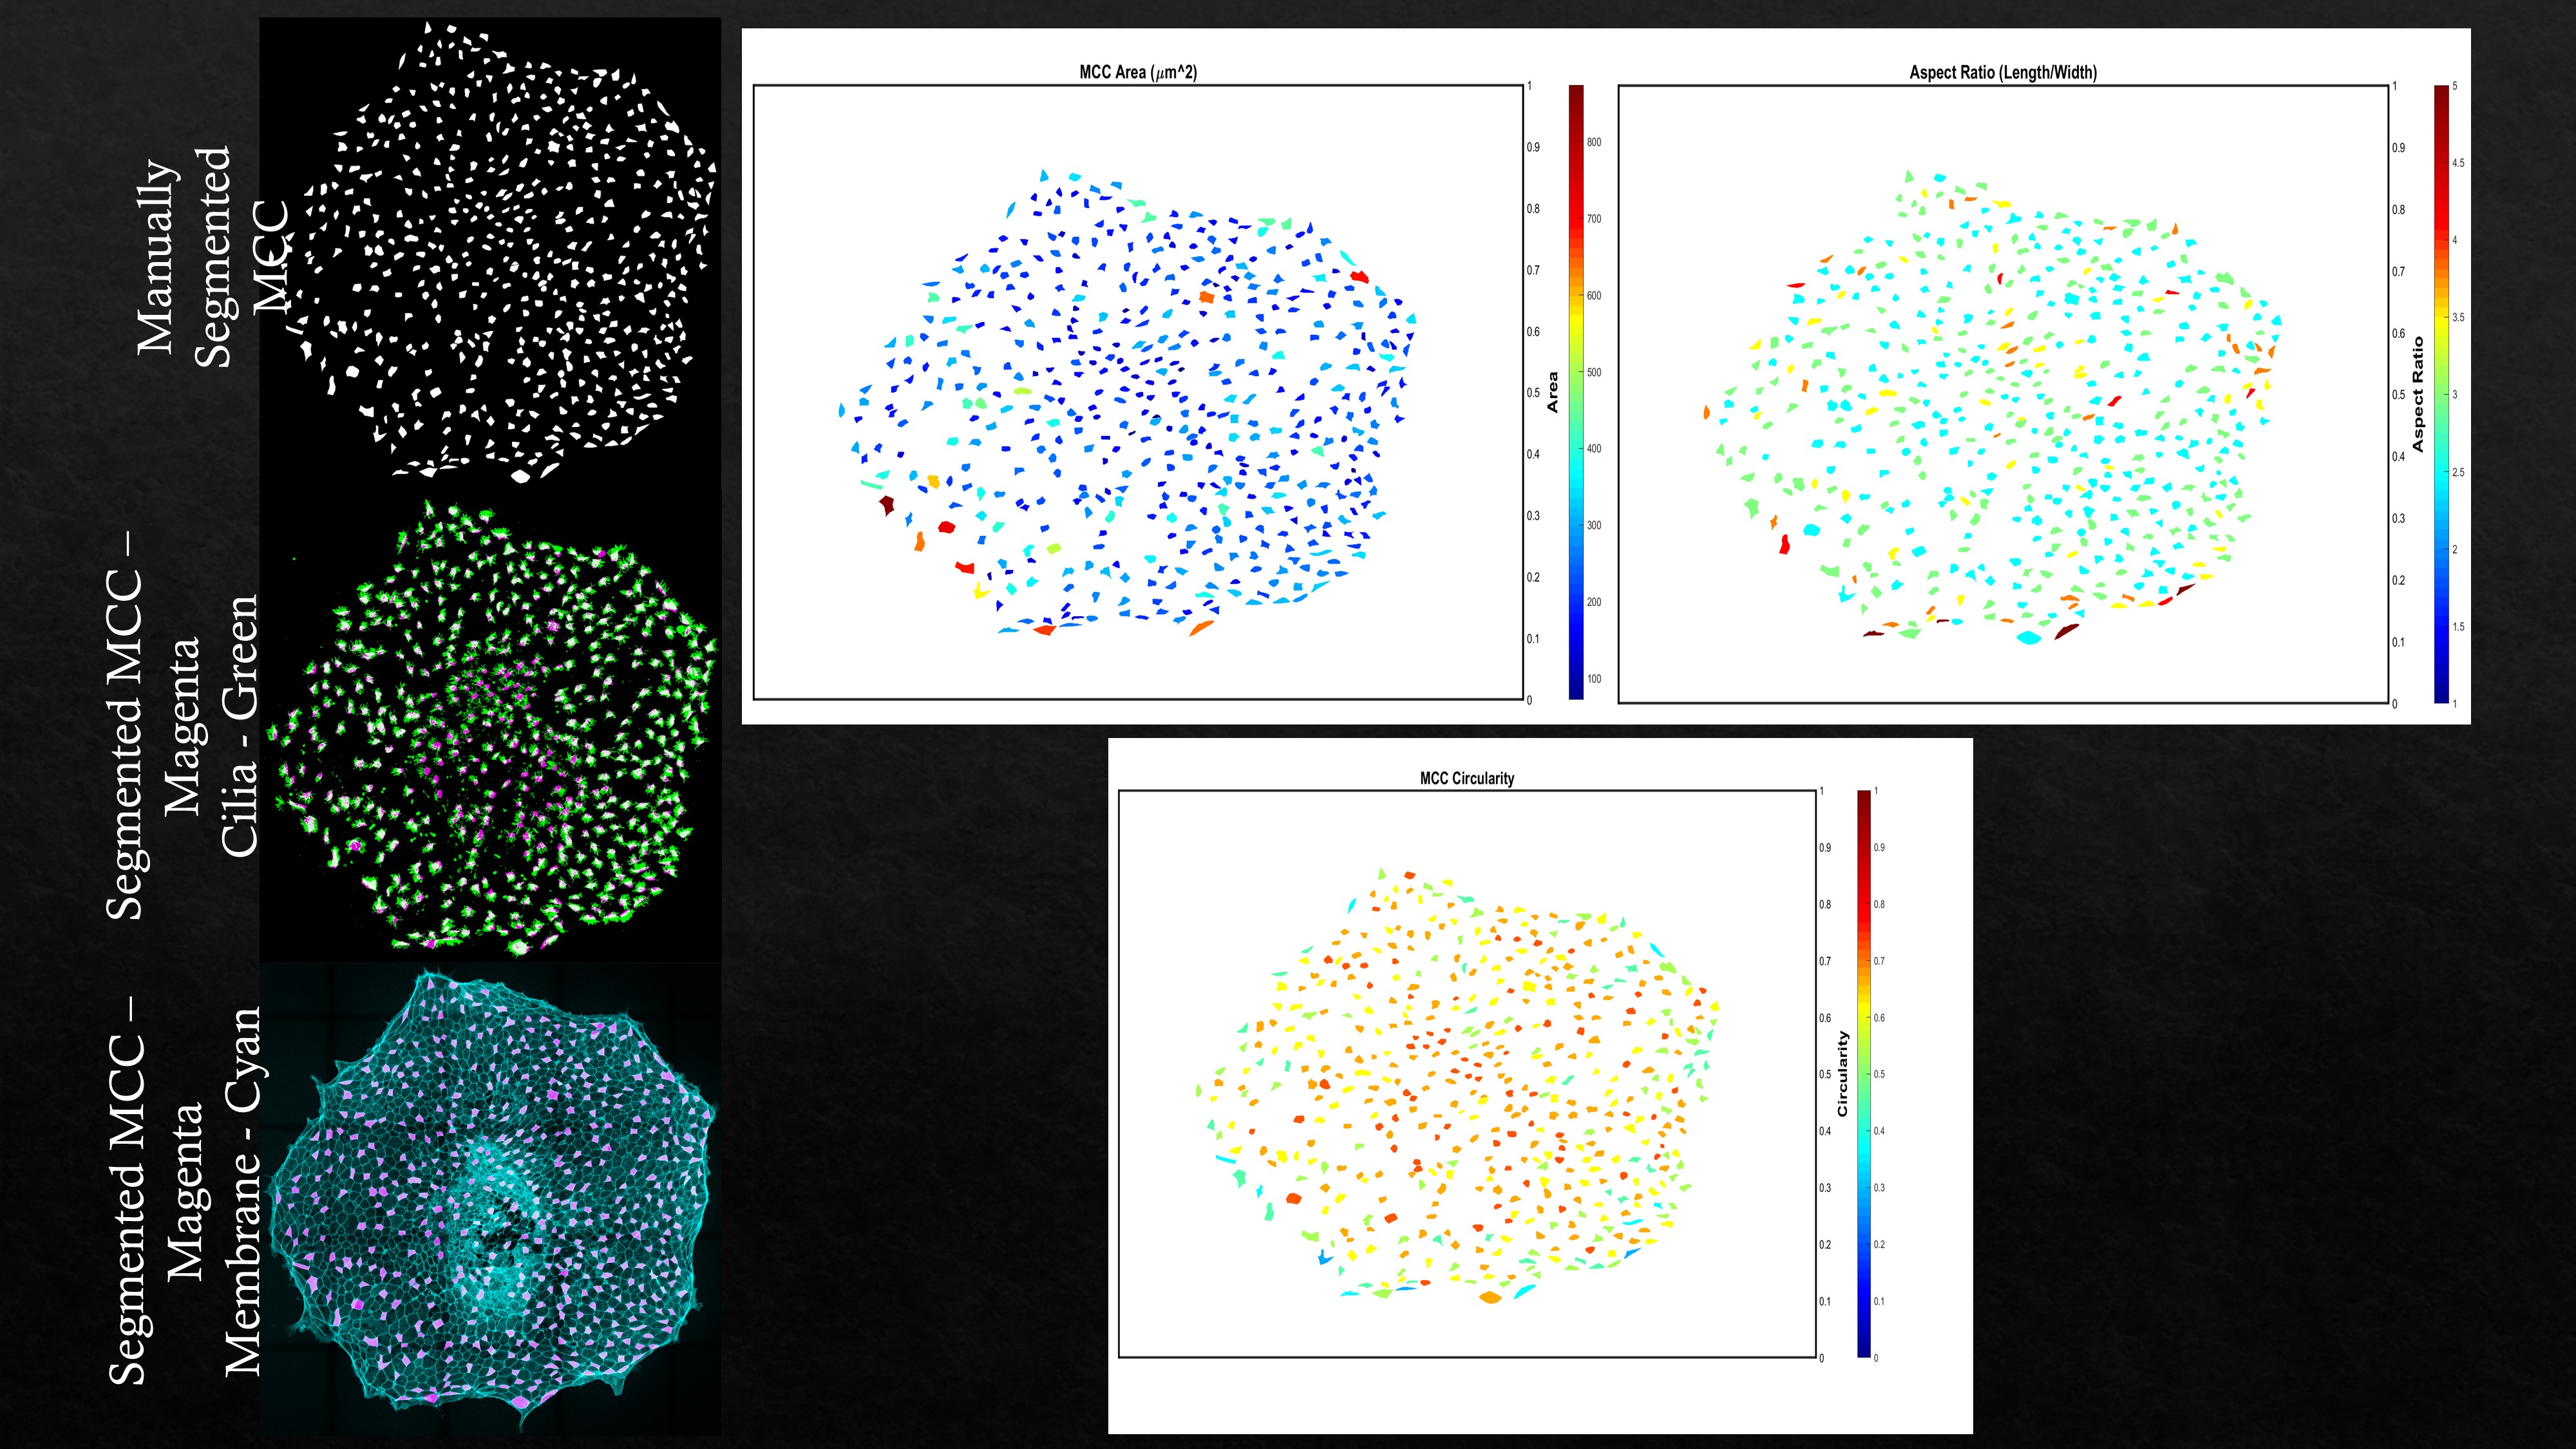
Another example multiciliated cell properties (cell area, cell aspect ratio, and cell circularity) extracted from animal cap explants (Xenopus tropicalis explants) are shown.
Basal Body Segmentation
In multiciliated cells (MCCs), during ciliogenesis hundreds of centriole derived basal bodies dock to the cell membrane giving rise to hair-like projections or cilia. Centrin or chibby are usually used as protein markers to visualize the base portion of cilia. This custom written MATLAB script can automatically segment fluorescent centrin/chibby images after trying out different threshold values. The script also returns total number of basal bodies within a cell based on region of interest (ROI) mask drawn around the cell. Alternatively, this MATLAB script can also be used for segmenting noisier centrin/chibby signals.

An example basal body segmentation is shown using centrin marker.
Cilia orientation
In multiciliated cells (MCCs), cilia orientation can be found by tracing clamp (cylindrical) to centrin (spherical) signals. Running this MATLAB script allows the user to trace each cilia direction within a cell followed by cell boundary. This interface allows users to trace cilia orientations in multiple cells and also get the cell properties of each traced cell as described in the cell property visualization & analysis section above. The results are saved in an excel file and stored in the local path of the code. The angles are measured from -180 to +180 degrees (counter-clockwise). For only tracing cilia orientations but not the cell boundaries pertaining to those cilia use this MATLAB script.

Cilia orientations traced for a multiciliated cell along with corresponding polar histograms are shown in the figure above.