Machine learning prediction of cellular Stresses in response to chemical perturbation
Vignesh
12 00 AM ,Tue, Jul 25 2023
Abstract
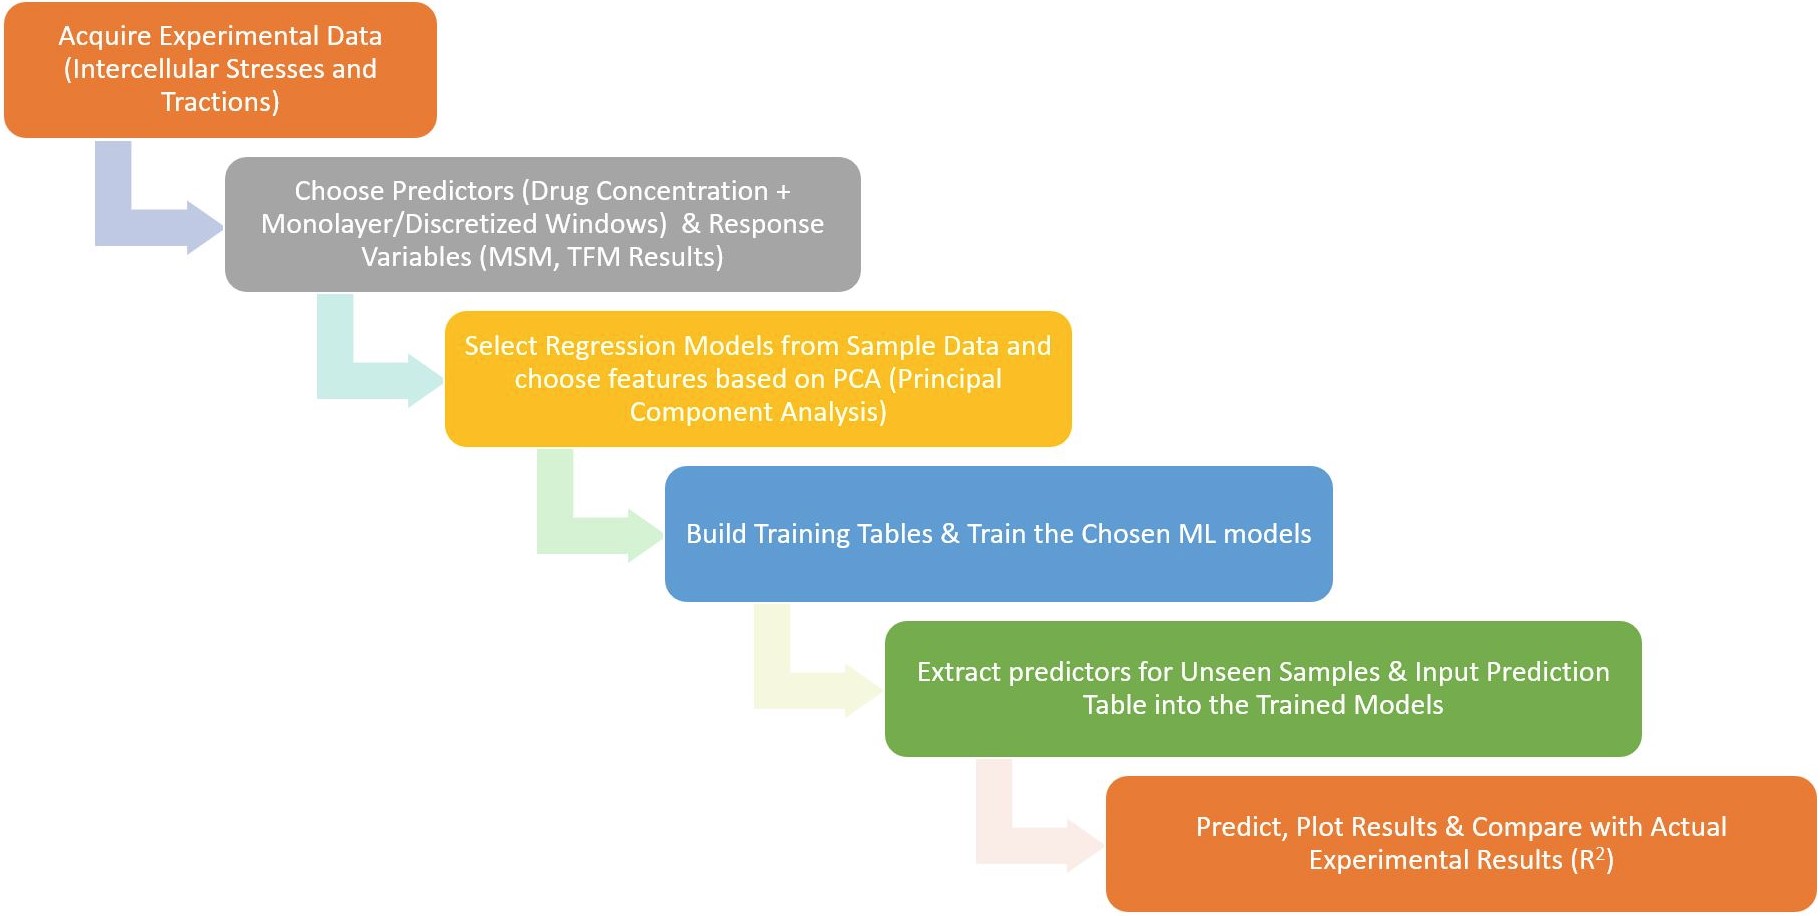
Mechanical stresses generated at the cell-cell level and cell-substrate level have been suggested to be important in a host of physiological and pathological processes. However, the influence various chemical compounds have on the mechanical stresses mentioned above is poorly understood, hindering the discovery of novel therapeutics, and representing a barrier in the field. To overcome this barrier, we implemented two approaches: 1) monolayer boundary predictor and 2) discretized window predictor utilizing either stepwise linear regression or quadratic support vector machine machine learning model to predict the dose-dependent response of tractions and intercellular stresses to chemical perturbation. We used experimental traction and intercellular stress data gathered from samples subject to 0.2 or 2 mg/mL drug concentrations along with cell morphological properties extracted from the bright-field images as predictors to train our model. To demonstrate the predictive capability of our machine learning models, we predicted tractions and intercellular stresses in response to 0 and 1 mg/mL drug concentrations which were not utilized in the training sets. Results revealed the discretized window predictor trained just with four samples (292 images) to best predict both intercellular stresses and tractions using the quadratic support vector machine and stepwise linear regression models, respectively, for the unseen sample images.
The ML framework we present here can be used to predict the mechanical response of any cell type capable of adherence to a flexible substrate as a function of chemical perturbation. The proposed ML can directly predict the intercellular stresses or tractions as a function of drug dosage and/or monolayer/cell coverage area which could potentially reduce the experimental time on studying the mechanics of cells to external chemicals or mechanical constraints. We believe our findings could be helpful in accelerating drug discovery and increase our understanding in the role of cellular stresses during disease progression.
Publication Link: Machine learning prediction of cellular Stresses
Prediction of Traction and Intercellular Stress Maps
Overview of building machine learning models for traction force and intercellular stress predictions
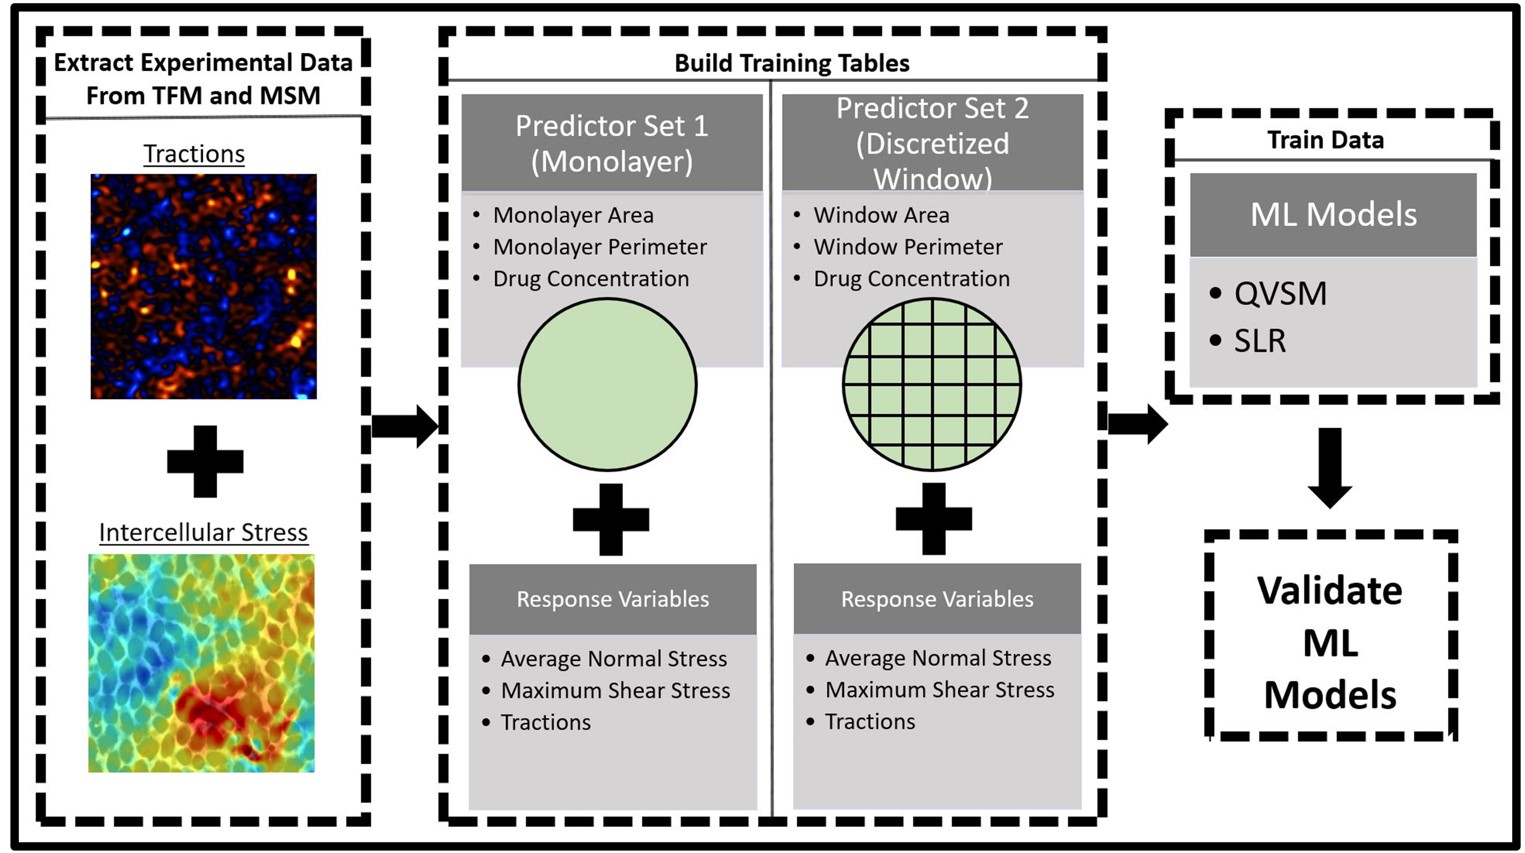
Figure showing implementation of machine learning approach to predict intercellular stress and tractions. The QSVM and SLR machine learning models were used along with two predictor sets: 1) monolayer boundary set and 2) discretized window set
Monolayer Boundary Predictor Vs. Discretized Window Predictor
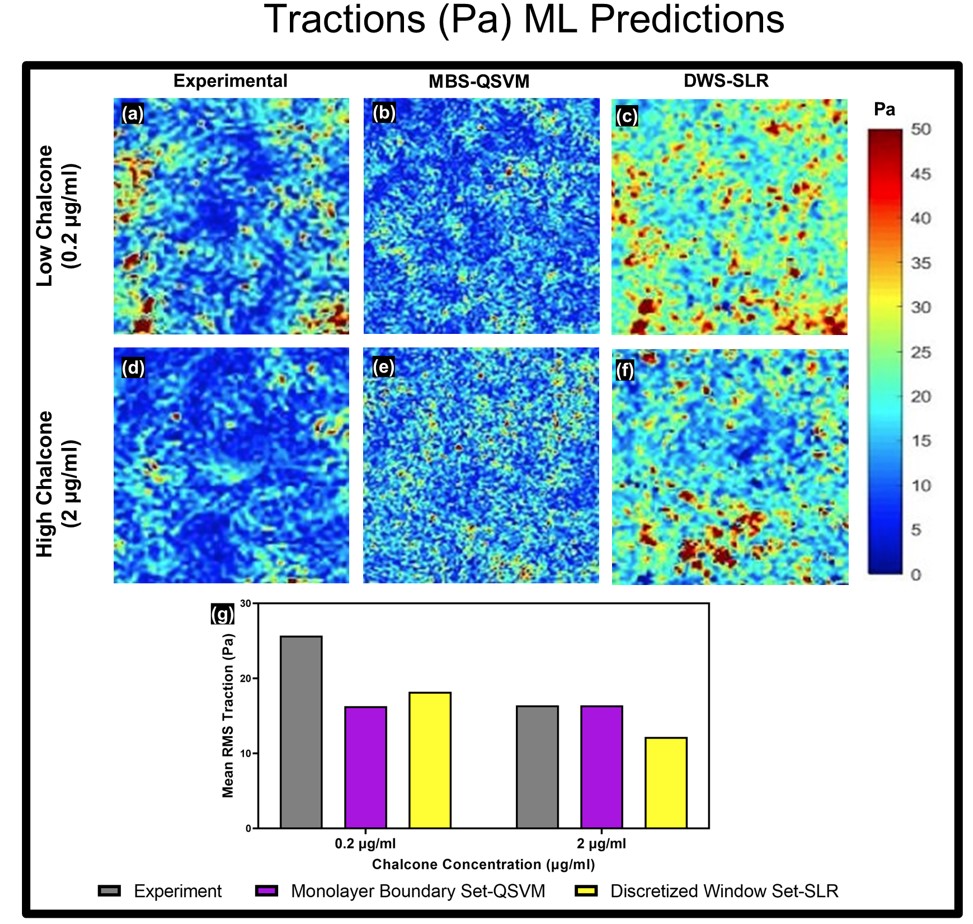
Predicted tractions using monolayer boundary and discretized window predictors. Experimental-, MBS-QSVM-, and DWS-SLR-predicted RMS traction distributions for 0.2 mg/mL chalcone concentration (a–c) and 2 mg/mL chalcone concentration (d–f) and the corresponding averages from three samples for each condition with standard errors shown in the bar plot (g)
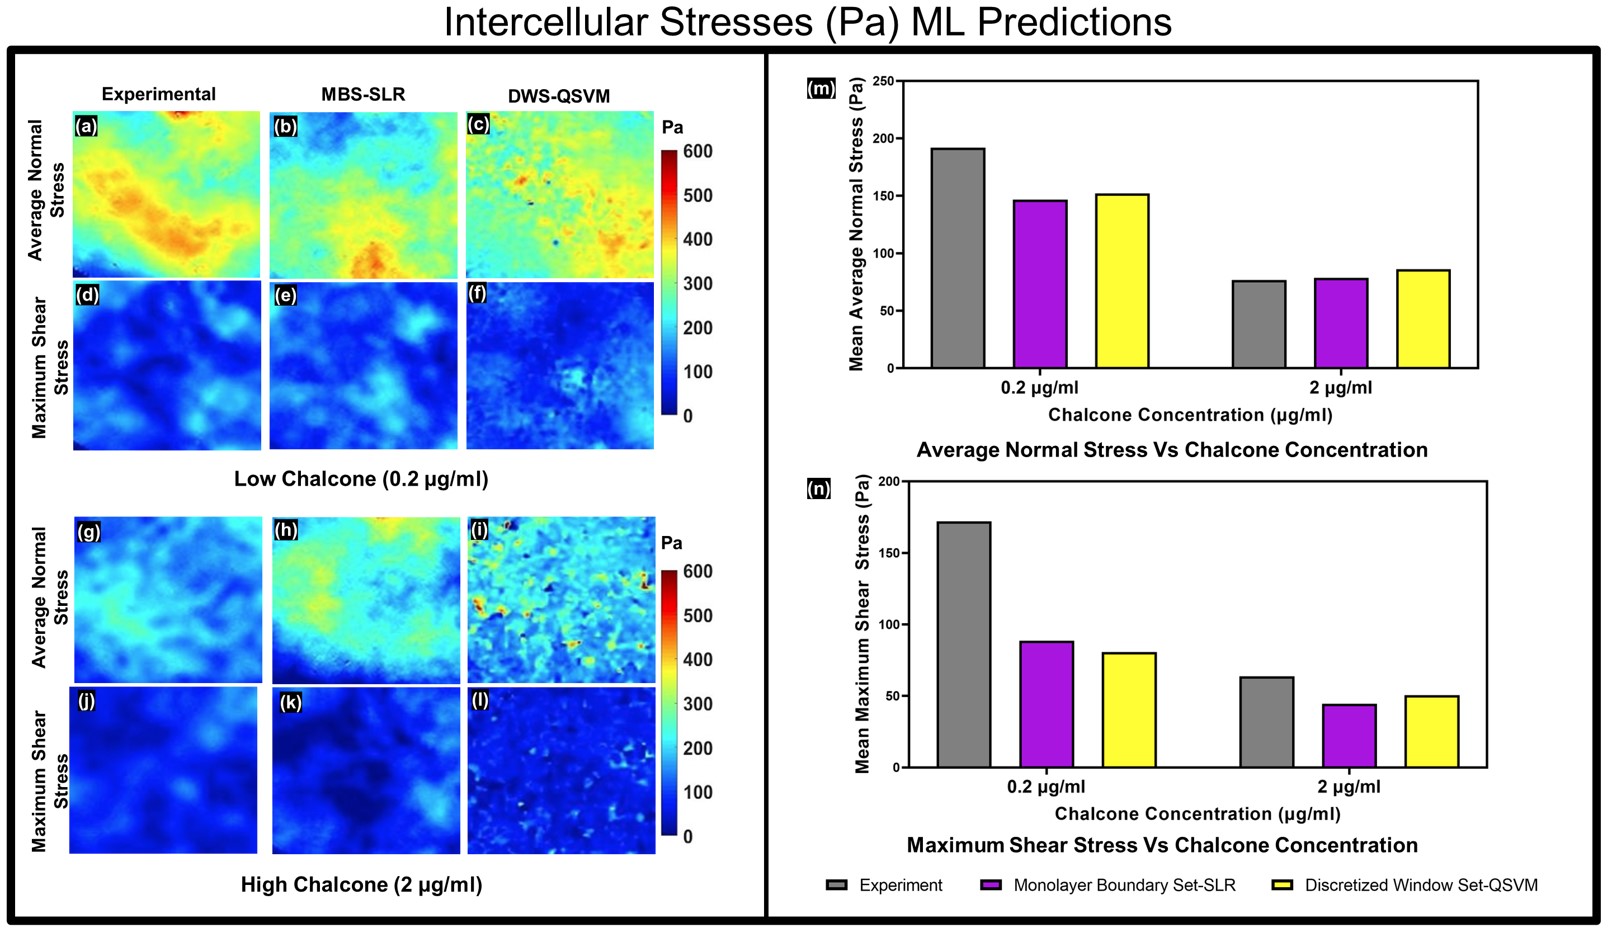
Predicted intercellular stresses using monolayer boundary and discretized window predictors. Experimental-, MBS-SLR-, and DWS-QSVM predicted average normal stress distributions for 0.2 mg/mL chalcone concentration (a–c) and 2 mg/mL chalcone concentration (g–i). Experimental-, MBSSLR-, and DWS-QSVM-predicted maximum shear stress distributions for 0.2 mg/mL chalcone concentration (d–f) and 2 mg/mL chalcone concentration (j–l). Corresponding averages of the distributions from three monolayers for each condition with standard errors are shown in (m and n) for average normal and maximum shear stresses, respectively
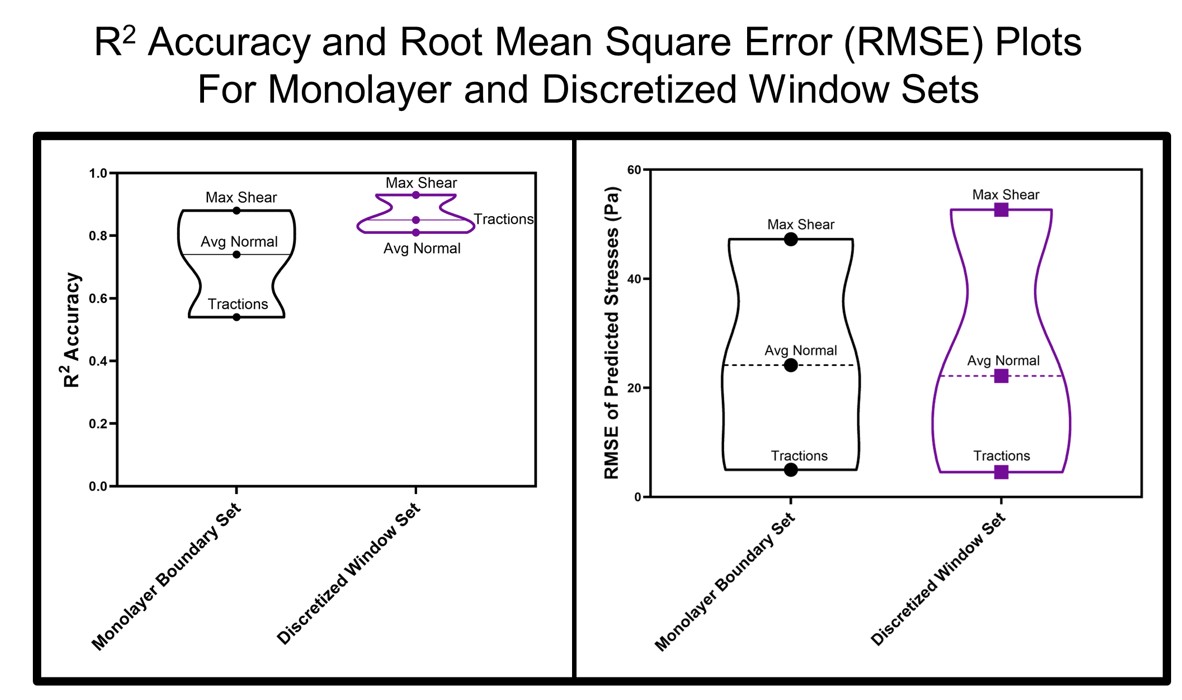
R-Squared accuracy and root-mean square error (RMSE) plots for monolayer boundary and discretized window predictors’ overall R-Squared accuracy (a) and RMSE in Pa (b) for RMS traction, average normal stress, and maximum shear stress predictions using the monolayer boundary set (MBS) and the discretized window set (DWS). MBS utilizes QSVM for traction predictions and the SLR model for intercellular stresses predictions while DWS utilizes SLR for traction and QSVM for intercellular stresses predictions